Kraft Prediabetes Profile: Patterns Overview
Prediabetes | Meridian Valley Lab
Why Dr. Kraft’s Research Still Matters
Dr. Joseph R. Kraft, a clinical pathologist, conducted over 3,650 glucose–insulin tolerance tests to detect diabetes mellitus earlier and more accurately than glucose alone.
While many patients showed “normal” glucose tolerance by ADA criteria, a deeper look revealed something else:
- Over 50% of glucose-normal results were abnormal when insulin curves were measured
- Another 14% were borderline
- About 2.5% displayed insulin responses indicating future trouble
This insight—that glucose-only testing can miss early insulin dysfunction—is the foundation of the Kraft Prediabetes Profile.
The Power of Pattern Recognition
Dr. Kraft’s work led to five characteristic insulin response patterns that help clinicians recognize insulin resistance and insulinopenia well before fasting glucose becomes abnormal.
The Five Kraft Patterns
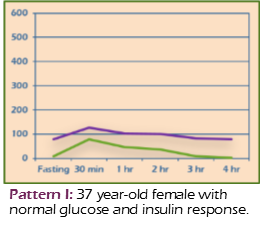
I: Normal Response
Show Section
- Fasting insulin: 0–10 units
- Peak insulin at 30–60 minutes
- 2nd and 3rd-hour totals: < 60
- Return to fasting by 3rd hour
Example: 37-year-old female with normal glucose and insulin response.
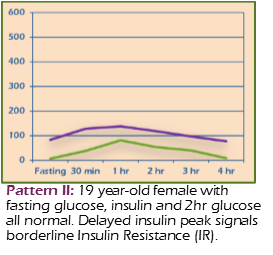
II: Delayed Peak
Show Section
- Fasting insulin: 0–10 units
- Later insulin peak; borderline resistance if totals 60–100
- Definite resistance if totals > 100
Example: 19-year-old female with normal fasting glucose/insulin and 2-hr glucose; delayed peak suggests borderline insulin resistance (IR).
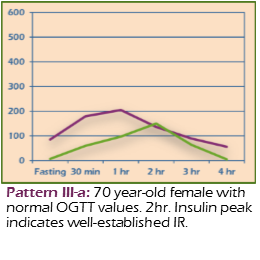
III A & III B: Insulin Resistance
Show Section
- Peak insulin at 2nd hour (III A) or 3rd hour (III B)
- Glucose may be borderline or diabetic
- Indicates diminished sensitivity to insulin
Example: 70-year-old female with normal OGTT glucose; 2-hour insulin peak indicates established IR.
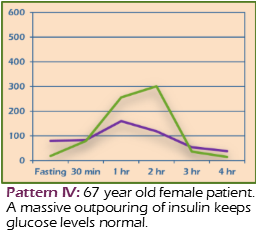
IV: Overt Resistance
Show Section
- Fasting insulin > 10 units
- Diagnostic for insulin resistance
- High likelihood of diabetic glucose levels
Example: 67-year-old female; massive insulin outpouring maintains normal glucose.
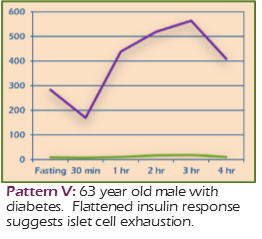
V: Insulinopenic Response
Show Section
- Low insulin across all time points (< 30)
- Seen in type 1 diabetes or exhausted β-cells
- May appear with normal glucose in low-carb individuals
Example: 63-year-old male with diabetes; flattened insulin response suggests islet exhaustion.
Beyond Blood Sugar: Hidden Hypoglycemia & Modern Use
Show Section
Hidden hypoglycemia: Dr. William Hudspeth paired glucose–insulin testing with EEG monitoring and found some patients experienced hypoglycemic symptoms without obvious glucose dips—often correlating with abnormal insulin peaks.
Modern use in practice: In functional and integrative settings, the Kraft Prediabetes Profile helps detect metabolic dysfunction earlier, identify IR in low-carb or keto-adapted individuals, and guide interventions for fatigue, weight gain, and hormonal imbalance—bringing clarity to puzzling metabolic presentations.
References
Click to View References
- Kraft JR. Detection of Diabetes Mellitus, In Situ (Occult Diabetes). Laboratory Medicine. Vol VI, No. 2. February 1975.
- Hudspeth WJ et al. Neurobiology of the Hypoglycemia Syndrome. Journal of Holistic Medicine. Vol III, No. 1. Spring/Summer 1981.